Spanish researchers map faults to individual modules across utility-scale PV plants with 96.6% detection accuracy
A UAV-based three-phase framework developed at Universidad Autónoma de Madrid locates and quantifies faults at the individual module level in large-scale solar plants, validated on two operational sites in England.
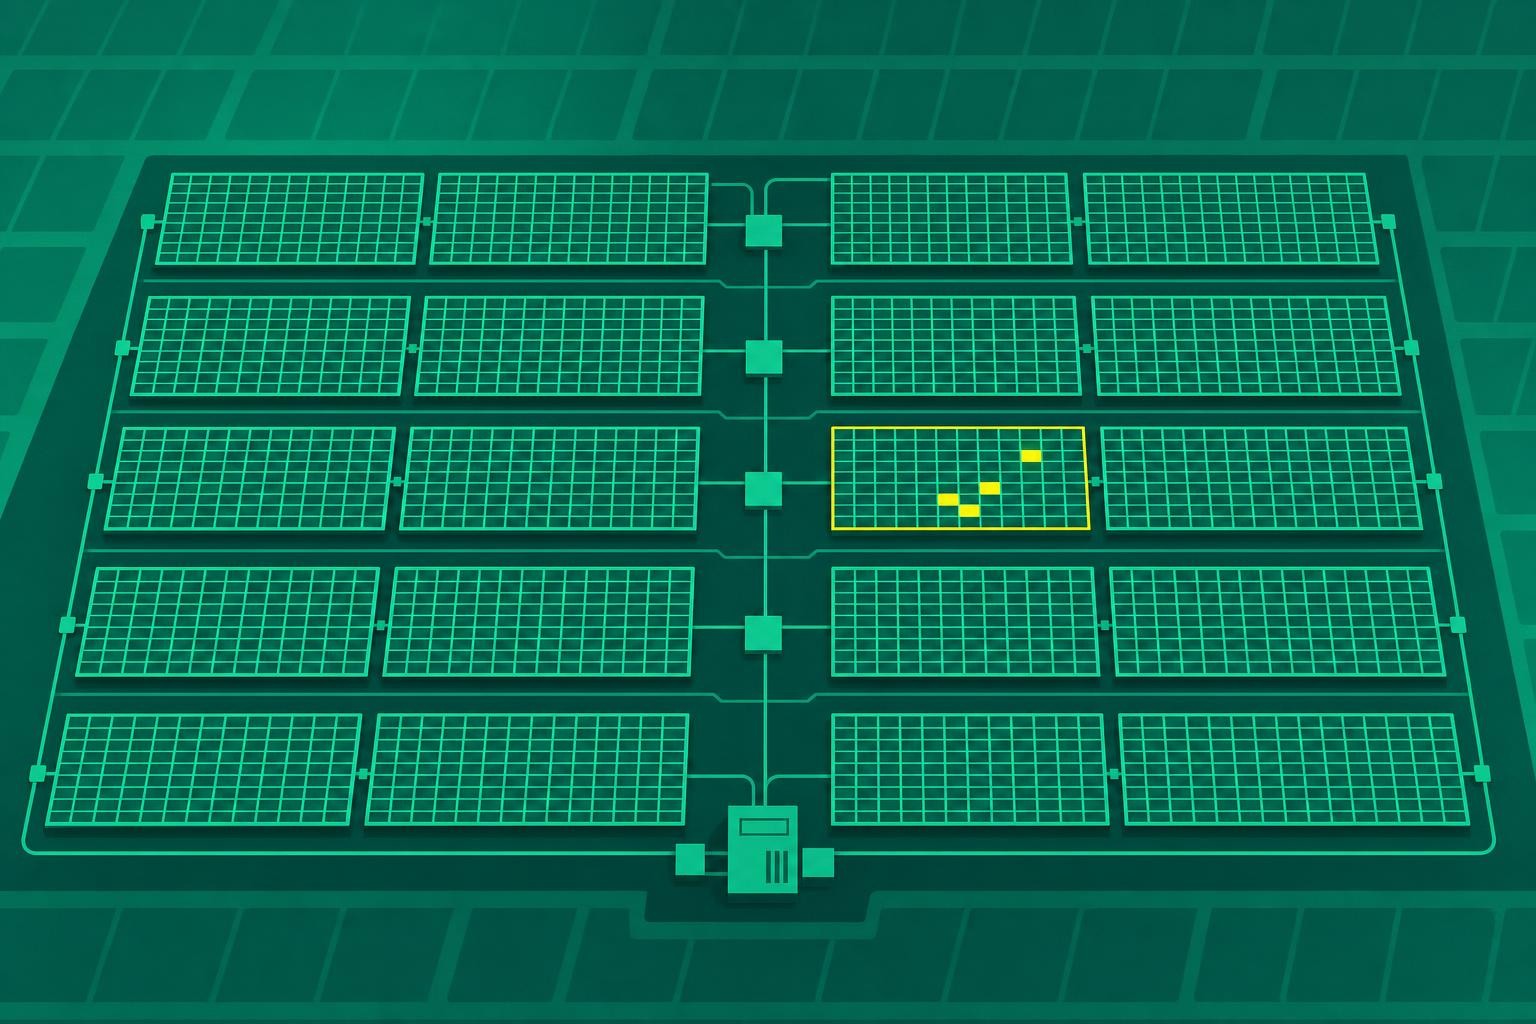
A team of researchers from Spain has published a three-phase framework that does something most existing inspection tools cannot: it locates a thermal fault in a utility-scale PV plant and assigns it to a specific module, then quantifies how severe that fault is - all without requiring a pre-existing plant layout[1]. The paper, led by corresponding author Isaac Segovia Ramírez of Universidad Autónoma de Madrid, appears in Applied Energy[1].
What the framework does
Most machine-learning approaches to PV inspection stop at classifying the type of fault - hotspot, broken cell, bypass-diode failure. The new framework goes further, combining fault location and defect quantification in a single pipeline, which Ramírez described as the main novelty of the work[1].
The method runs in three sequential phases[1]:
- Flight geometry modelling - UAV flight parameters, camera characteristics, GPS position, and module dimensions are used to calculate ground sampling distance and convert image coordinates into approximate real-world positions.
- Thermal defect detection and quantification - a transformer-based deep-learning model processes thermal images at pixel level, extracting temperature values and assessing fault severity using indicators including maximum and average temperature difference, the 95th temperature percentile, thermal variance, affected physical area, and integrated thermal contrast.
- Module-level fault mapping - overlapping UAV images are stitched into a georeferenced orthomosaic using OpenDroneMap; YOLOv8 identifies PV strings, while Segment Anything Model 2 and histogram analysis segment and count individual modules, allowing each thermal anomaly to be pinned to a specific unit.
Test conditions and results
The team validated the framework on two operational plants in England: an 8 MW facility with more than 38,000 modules and a 3 MW facility with more than 17,000 modules[1]. Data were collected over two consecutive days at estimated irradiance levels of approximately 600-780 W/m², using different UAVs and thermal cameras - including a DJI Mavic 2 Enterprise - to test robustness across varying acquisition conditions[1].
Flights produced overlapping infrared and RGB images processed into orthomosaics at 5 cm per pixel resolution[1]. Targeted fault types included hotspots, broken or defective cells, open circuits, and bypass-diode failures. Selected anomalies were validated 15 times against an independent SI-131 radiometric infrared sensor[1].
Key performance figures[1]:
- Module-detection accuracy: 95% to 98.55%, with only 20 modules missed in the best-performing test case
- Row-alignment errors: approximately 6-8 cm; mean angular deviations below 2°
- RoboFlow-DETR model precision during validation: 88.58%
- Overall fault-detection accuracy across the case studies: 96.6%
The gap between existing approaches and this one is meaningful in operational terms. A trained technician can cover roughly 1-2 MW per day on foot using a handheld thermal camera, meaning a 50 MW site requires 25 to 50 working days for a full inspection. A drone covers the same 20 MW in two to four hours. The Spanish framework adds a layer those aerial surveys have generally lacked: a precise address for each fault, not just a thermal flag somewhere in a stitched image.
Why fault location matters for O&M
Knowing that a plant has hotspots is useful. Knowing which of 38,000 modules contains each one - and how severe it is - is what drives a dispatch decision. Most operators run one or two inspections per year, which means faults developing between cycles go undetected for months. A framework that can generate a module-level punch list from a single UAV flight compresses the time between detection and corrective action.
Solar thermography has moved from a specialized diagnostic tool to a core O&M obligation, but inspection costs ranging from $150 to $600 per MW mean asset managers need to extract maximum actionable information from each survey. Severity quantification - not just detection - is what justifies prioritizing one repair over another when budgets are constrained.
What comes next
Ramírez told pv magazine the team plans to validate the methodology across several additional large-scale plants and improve automatic fault classification[1]. For commercial deployment, the researchers intend to implement the pipeline on IoT platforms where operators can upload UAV imagery and receive a structured report[1] - a workflow that would make module-level fault location accessible without specialist in-house capability.
The immediate question for asset managers is whether the 96.6% detection rate and sub-10 cm spatial accuracy hold across different climates, module types, and plant geometries. The England trials used a narrow irradiance window; performance under lower or more variable irradiance - common in northern European markets - remains to be demonstrated at scale.
The images and texts on this page were created with the help of AI.
Related
Ready-to-build BESS projects lose their premium as Australia's NEM arbitrage spreads collapse 85%
Panellists at the Battery Asset Management Summit Australia 2026 said the venture-capital-style returns that once rewarded ready-to-build BESS projects have disappeared as NEM price spreads fell 85% in a year.
10 Sept 2026UK government opens three-month consultation on AI for clean energy, backed by 34-recommendation network review
DESNZ published its Vision for an AI-enabled clean energy system on 8 September, opening a call for evidence that closes 6 November and will feed into the UK's first AI for Clean Energy Strategy.
10 Sept 2026Heatwaves expose a three-layer risk for wind operators: resource, hardware, and people
Extreme heat cuts wind output, stresses nacelle components, and grounds maintenance crews - all at once. A look at how bad the summer of 2026 has been, and what the trend means for grid reliability.
10 Sept 2026